
Introduction to Advanced Statistics and the Columbus Blue Jackets

In 2003 Michael Lewis published a book that revolutionized the way everyone looks at statistics in baseball. The book was called Moneyball: The Art Of Winning An Unfair Game. It’s likely that you watched the movie version because it was fairly successful, starring Brad Pitt and Jonah Hill. The book examined the Oakland Athletics ability to make the playoffs and remain very competitive when they had one of the league’s smallest salaries.
These advanced statistics in baseball, called Sabermetrics, have given team’s a better advantage when scouting talent and building more successful teams. They’ve become universally accepted in baseball. Even the NBA has embraced advanced statistics.
The sport of hockey has typically relied on a player’s primary statistics, like point production and plus/minus to evaluate how effective they are to their team’s success. However, over the last several years teams have begun to gain access to a new set of statistics. Some teams, like the Colorado Avalanche, have even employed a statistician to their front office with the purpose of looking deeper into the numbers. It’s possible that you’ve come across a conversation or article recently that uses these statistics, which are typically called advanced statistics, Corsi or fancy stats.
I’m not going to attempt to bog every article down with numbers and phrases you have never heard of, but I believe these numbers have a power to give us an objective look into a sport that goes beyond what the eye can see.
Corsi
Corsi is likely to be the first and most common statistic that is brought up in the fancy stats community. Corsi is defined as the sum of blocked shots, missed shots and shots on goal. The idea is that teams who have a higher Corsi generally dominate puck possession and is therefore believed to have the better chance of scoring more goals. Save percentages and a player’s or team’s shooting percentage can alter the outcome, but overall it’s been fairly accurate in judging who the best teams are.
For example, last season’s Stanley Cup Champion Chicago Blackhawks were fourth in Corsi For Percentage. (CF% = Corsi For/ [Corsi For + Corsi Against]) The season prior, The Los Angeles Kings won the Cup when their CF% was second best in the league. Also, between the 2008-09 season and the 2011-12 season, the team with the better Corsi going into a playoff series won that series 57.3% of the time.
Fenwick
Fenwick was created by blogger Matt Fenwick. Essentially it is the same thing as Corsi but blocked shots are removed from the equation. It’s believed that Fenwick has a more accurate ability to predict who will score more goals. Shot blocking can be an effective statistic to look at separately, however Corsi is still used by most writers.
PDO
PDO is the sum of shooting percentage and save percentage. If a team is winning games but their Corsi numbers are unfavorable, they probably have a high PDO. These numbers tend to even out over time to an average of 100.
To make it a little more understandable let’s say, hypothetically, that the Blue Jackets go on a ten-game winning streak. During that streak their goaltenders are averaging a .950 save percentage, while the rest of the team is scoring on 20% of their shots they take. This would be considered an anomaly because their PDO is 115 (95 +20) and it should, and most likely will, even out around 100.
The Toronto Maple Leafs are a good example of a team who enjoyed early season success with a high PDO, but are beginning to level out and lose more games than they win. They are currently second to last in the league in CF%, ahead of only the Buffalo Sabres.
How it can be applied to the Blue Jackets
Well, these stats can be applied to all teams, obviously, but I’m the Blue Jackets contributor and I’ll primarily concentrate on their stats for the time being.
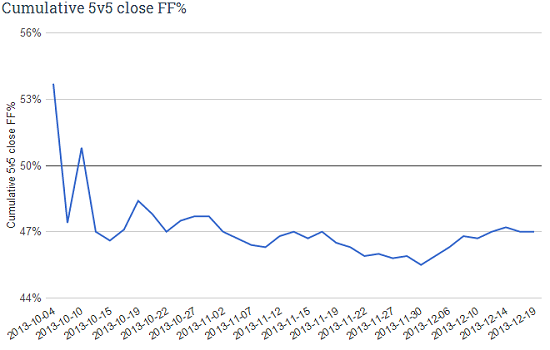
Extraskater.com is a new website that has only tracked fancy stats over the past two seasons, however it is proving to be one of the more user-friendly sites. (Other sites that are very popular for raw stats are stats.hockeyanalysis.com and behindthenet.ca, their data goes back to the 2007-08 season.) ES provides us charts like these to examine how the Blue Jackets Fenwick For Percentage (FF%) has looked throughout the season. 5v5 close FF% means that these stats were pulled while the score was tied, or within one goal during 5 0n 5 play.
The reason we would want to look at these numbers when the score is close is due to the fact that some teams sit on larger leads and go into a defensive shell to avoid losing the game, therefore they are not taking as many shots. Looking at these stats while the score is close provides a more accurate reading for which team is dominating the puck possession play when it really matters.
As you can see, the Blue Jackets started off strong before they leveled out around 47% on the season up to this point. This is not very good and they currently rank 24th in the league.
To draw a comparison here is the FF% for the Chicago Blackhawks, who are currently the best team in FF% this season.
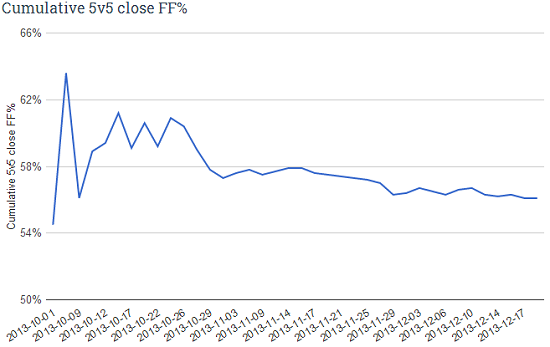
So, you’re probably saying that obviously the Blackhawks are better than the Blue Jackets. I don’t need a chart to tell me that. However these numbers can be beneficial when you want to make an objective view of which team is better. It’s more difficult to decide whether the St. Louis Blues are more likely to win a game than the San Jose Sharks, for example. The second place team in the Metropolitan Division, the Washington Capitals are 46.1% in FF% on the season. With a possession game like that, they may make the playoffs but their game relies on special teams to score and win games. These powerplay scenarios are less likely to happen in the playoffs and could explain why the Capitals were eliminated in the first round last season. It’s likely the Capitals won’t match up well in the postseason again if their possession play continues to look so bad.
What drives teams to better possession play
Many factors go into determining a team’s possession percentage, everything from coaching strategies to rosters and even team lineups can have an effect on possession play. This is only an introduction, but over the course of my next few articles I will begin to dissect and analyze the advanced statistics to help shed some light on the Blue Jackets season.
The goal is to provide a different look at what can drive success for a team and who are the players that are the most effective on the team while making it easy to understand.
Nick Biss
Latest posts by Nick Biss (see all)
- Rick Nash Becomes the Villain in Columbus - March 23, 2014
- Blue Jackets Lose An Exciting Game to the Sharks, Which was Ruined by a Shootout - March 14, 2014
- Blue Jackets Forward Blake Comeau Suspended Two Games For Boarding Red Wings Brendan Smith - March 12, 2014