Hello guys and gals!
Thank you for following along diligently with my series on the history of NHL trophies and more importantly, the names behind them. This week we look into the past of a former manager of both the Toronto Maple Leafs and Montreal Canadiens General Manager, Frank J. Selke. Most importantly however, is not his championship pedigree, but the fact that he is forever immortalized as “ASS MAN” on a Stanley Cup engraving.
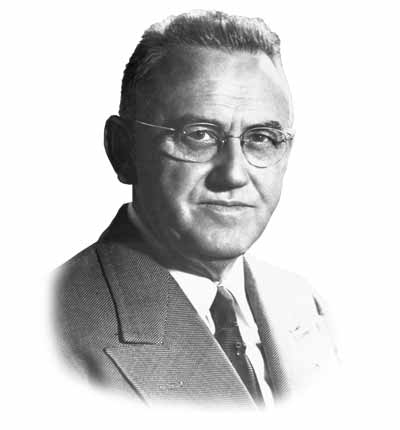
Who was the Ass Man… err, Frank J. Selke?
Francis Joseph Aloysius “Frank” Selke was born May 7, 1893 in Berlin (now Kitchener), Ontario. He lived a relatively quiet young life, although he always showed a penchant for leadership and managing, becoming manager of his local team, the Iroquois Bantams when he was only 13 years old.
Ottawa Citizen – June 2, 2009.
Selke was only started to dig into his managerial foundation at that point. He would go on from his initial managerial reign to test his skills at coaching, where he would coach the Berlin Union Jacks of the Ontario Hockey Association from 1912 through 1915. He coached the team all the way to the finals in his final season at the helm of the team.
From there Selke made a name for himself by winning the first ever Memorial Cup, the national junior championship in Canada, in 1919 in which the OHA pitted its best agains the best junior team of the west. Selke managed University of Toronto Schools team to 29-8 two game, total goals, championship series win over the Regina Patricia (now Regina Pats of the Western Hockey League).
Selke Sr. would become the coach of the Toronto Marlboros of the OHA, coaching eventual Hall of Famers like Red Horner and Joe Primeau.
Selke would further his championship pedigree by leading the Marlboros to four championships during his tenure. He would them take over the helm of the Toronto Ravinas, who were purchased by the Maple Leafs and renamed the Toronto Falcons. This move would begin his association with the Leafs and Conn Smythe. Selke would go onto to coach the Marlboros again once more in 1929, a season in which he would earn his second Memorial Cup.
After his Memorial Cup championship, Conn Smythe hired Selke as his assistant manager after the 1929 season. Selke would become acting manager while Smythe was away during WWII and would help raise funds for the construction of Maple Leaf Gardens.
As Frank’s son, Frank Jr. would remember it: “with the onset of “World War II” Mr. Smythe was called back to active duty, putting together his famous battalion that would eventually ship overseas to join the cause. In his absence my father was left to run not only the day-to-day business operations of the organization, but was also responsible for the buildings gem, the Maple Leafs hockey club. It was during this time that my father executed one of the most beneficial trades in Leafs history, acquiring future captain and legend Ted Kennedy from the Montreal Canadiens. With Kennedy in tow the Leafs would win two Stanley Cups in the 1940’s under my dads guidance.”
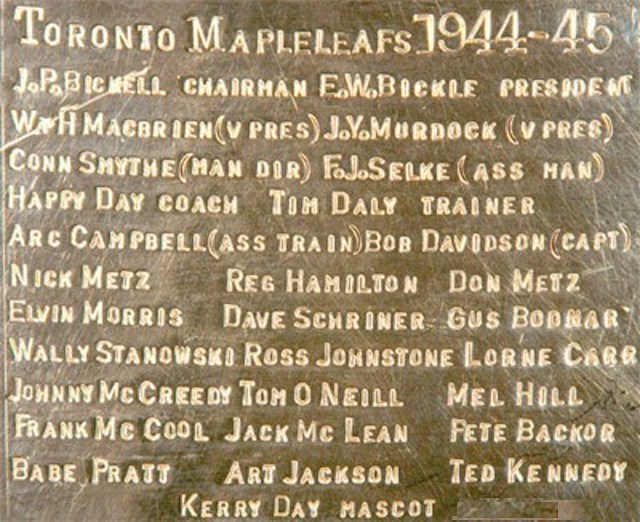
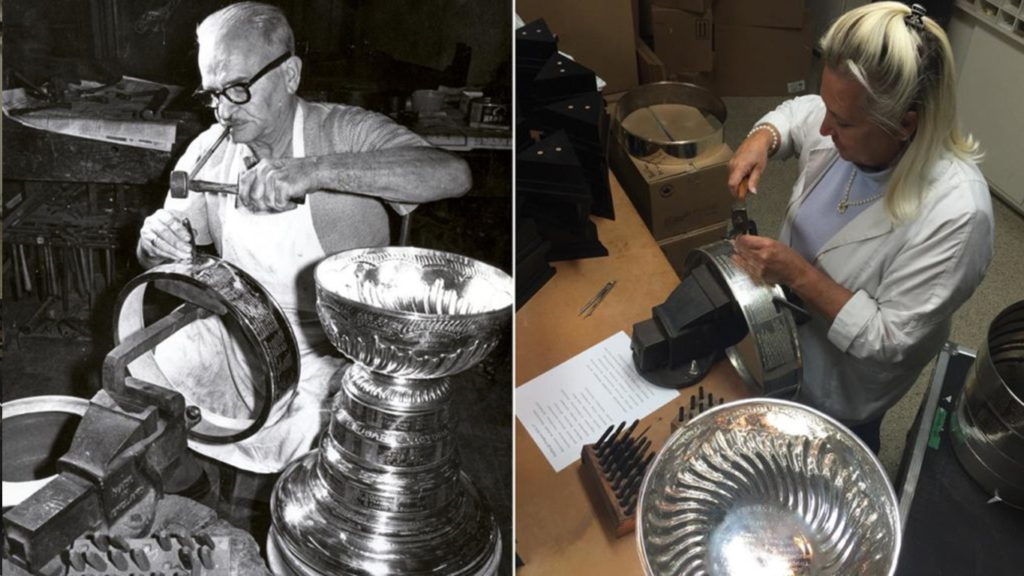
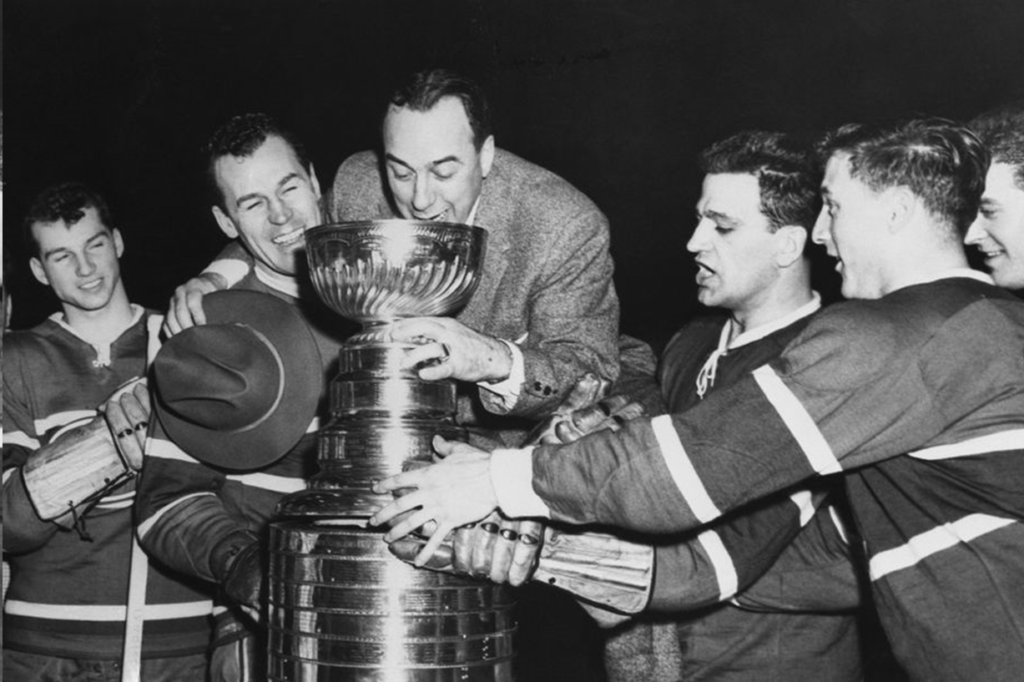
That trade was Selke’s eventual demise with Toronto, as he had not consulted Smythe before the trade. The player Toronto traded to Montreal, Frank Eddolls, was a Smythe favourite which made the working relationship untenable. Overall Selke would win three Cups during his time with the Leafs in the 1932, 1942, and 1945 seasons. The latter being the infamous “ASS MAN” season. For good measure, the league engraver at the time, Carl Petersen, put the assistant trainer in as “Arc Campbell – ASS TRAIN.”
ASS MAN and ASS TRAIN on the same team? That just wasn’t fair for the rest of the NHL in 1945
After
the discord between Selke in Smythe became completely unworkable. Selke Sr.
handed in his resignation at the end of the 1945 season. He was hired less than
two months later by the Montreal Canadiens to become the Habs General Manager.
Frank Jr said he accomplished his goals and more rather quickly in Montreal:
“It was very early in his tenure that he somewhat brashly announced that
the organization would win a Memorial Cup within three years and the Stanley
cup within five years. Not only did his hockey predictions turn out to be
correct, but within three years the organization itself began to turn a profit
and would never look back. The junior team would win the Memorial Cup in both
1949 and 1950, and the Canadiens would go on to win 6 Stanley Cups in the
1950’s including five in a row.”
Selke would oversee the Canadiens during their original five straight trips to the finals during the late 40s, and early 50s, losing three times to the rival Leafs and once to a Gordie Howe-led Detroit Red Wings. Finally, on his fifth try the Canadiens won the Stanley Cup in the spring of 1953. He followed that up with five straight Cups between 1956-1960.
Selke would manage up until 1964, when he retire and as Frank Jr said: “My father continued to run the organization until 1964 before retiring to his horse farm where he lived until passing away in 1985.”
What is the Frank J. Selke Trophy?
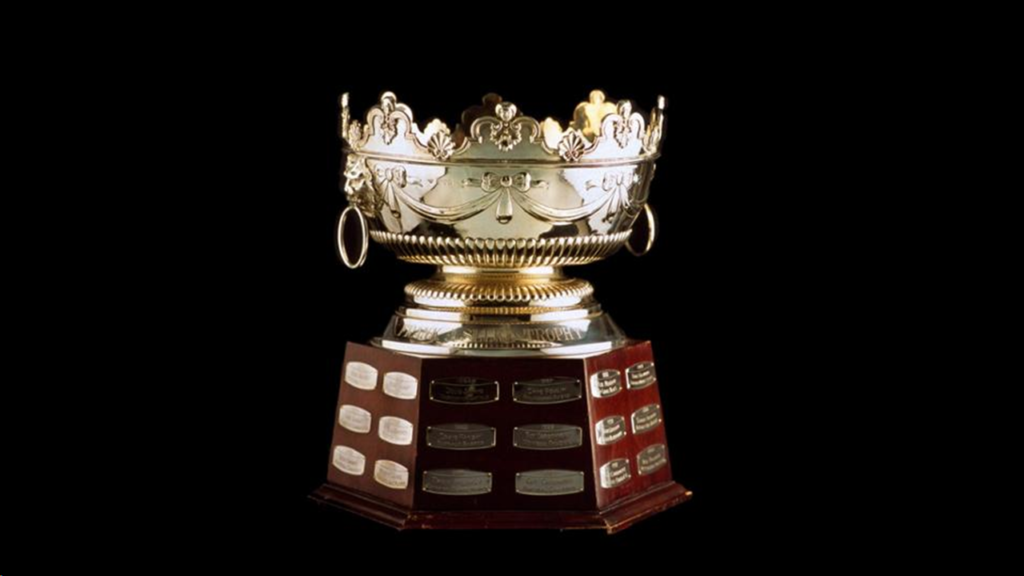
As the NHL website says: “The Frank J. Selke Trophy is an annual award given “to the forward who best excels in the defensive aspects of the game.” The winner is selected in a poll of the Professional Hockey Writers’ Association at the end of the regular season. It was first awarded after the 1977-78 season.”
The Selke Trophy was the fifth and last of the major individual NHL awards to be introduced that was named after general managers and owners of the Original Six teams; the others are the Art Ross Trophy, the Norris Trophy, the Conn Smythe Trophy and the Jack Adams Award.
Frank J. Selke Trophy Winners
- 2018: Anze Kopitar , Los Angeles Kings
- 2017: Patrice Bergeron , Boston Bruins
- 2016: Anze Kopitar, Los Angeles Kings
- 2015: Patrice Bergeron, Boston Bruins
- 2014: Patrice Bergeron, Boston Bruins
- 2013: Jonathan Toews, Chicago Blackhawks
- 2012: Patrice Bergeron, Boston Bruins
- 2011: Ryan Kesler, Vancouver Canucks
- 2010: Pavel Datsyuk, Detroit Red Wings
- 2009: Pavel Datsyuk, Detroit Red Wings
- 2008: Pavel Datsyuk, Detroit Red Wings
- 2007: Rod Brind’Amour, Carolina Hurricanes
- 2006: Rod Brind’Amour, Carolina Hurricanes
- 2004: Kris Draper, Detroit Red Wings
- 2003: Jere Lehtinen, Dallas Stars
- 2002: Michael Peca, New York Islanders
- 2001: John Madden, New Jersey Devils
- 2000: Steve Yzerman, Detroit Red Wings
- 1999: Jere Lehtinen, Dallas Stars
- 1998: Jere Lehtinen, Dallas Stars
- 1997: Michael Peca, Buffalo Sabres
- 1996: Sergei Fedorov, Detroit Red Wings
- 1995: Ron Francis, Pittsburgh Penguins
- 1994: Sergei Fedorov, Detroit Red Wings
- 1993: Doug Gilmour, Toronto Maple Leafs
- 1992: Guy Carbonneau, Montreal Canadiens
- 1991: Dirk Graham, Chicago Blackhawks
- 1990: Rick Meagher, St. Louis Blues
- 1989: Guy Carbonneau, Montreal Canadiens
- 1988: Guy Carbonneau, Montreal Canadiens
- 1987: Dave Poulin, Philadelphia Flyers
- 1986: Troy Murray, Chicago Blackhawks
- 1985: Craig Ramsay, Buffalo Sabres
- 1984: Doug Jarvis, Washington Capitals
- 1983: Bobby Clarke, Philadelphia Flyers
- 1982: Steve Kasper, Boston Bruins
- 1981: Bob Gainey, Montreal Canadiens
- 1980: Bob Gainey, Montreal Canadiens
- 1979: Bob Gainey, Montreal Canadiens
- 1978: Bob Gainey, Montreal Canadiens
Steve Auld
Latest posts by Steve Auld (see all)
- Former NHL player Daryl Evans discusses his transition from Toronto to LA, the growth of hockey in the US, and playing against Wayne Gretzky - December 3, 2021
- Post-Thanksgiving Reflection: Thankful or Cooked? - November 26, 2021
- BREAKING: Jack Eichel Traded To Knights - November 4, 2021