FeaturedNational Hockey League (NHL)
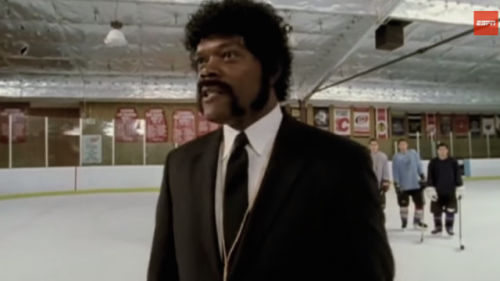
Samuel L. Jackson as Youth Hockey Coach Jules Winnfield
If you’ve ever played any form of organized hockey then you may have been just as fortunate to be coached by a real character.
And what if that character could be Coach Jules Winnfield played by none other than Samuel L. Jackson?
Well allow me to answer that with a trip back down memory lane from the 2002 ESPY’s from this classic clip:
Igor Burdetskiy
Founder, Editor-in-Chief, & CEO at Hooked on Hockey Magazine
I grew up playing Ball and Roller Hockey day and night somewhat religiously throughout elementary and middle school. The two don't compare though when I lace up the skates and hit the ice. I live and breathe hockey beyond the perspective of "it's just a game" and I will gladly talk hockey for hours with anyone. Hockey is more than just a lifestyle, it's a culture of passionate people who make memories every time the puck is dropped. Hockey has not only helped me get through some of the hardest times in life but has created some of the best memories to date. Want to talk hockey with me? Shoot me an email: iburdetskiy@hookedonhockey.com and let's talk some hockey!
Latest posts by Igor Burdetskiy (see all)
- Why Every Hockey Team Needs Custom Jerseys - October 26, 2025
- Stanley Cup Final Preview: Florida’s Structure vs. Edmonton’s Speed - June 4, 2025
- Stanley Cup Playoff Betting: Tips for Overtime Thrillers - April 6, 2025