
Why Suspensions Don’t Matter and how they can Be Fixed
A new year in the NHL is underway, and we can only hope that the first item on most players’ New Year’s resolution list is to stay off Santa’s naughty list by playing safer and to be more respectful of player safety. This season (so far) has been one of the worst in terms of suspensions handed out. We go through the same routine every year: seeing reckless incidents where players know better, ranting through social media, questioning the rules/nature of the game, then complaining that the suspension handed out was too long/short/just right.
Things haven’t changed, and it doesn’t appear that they will anytime soon. What’s the problem? Why do players continue to make bad plays knowing they’ll get suspended? And I keep finding myself asking myself the same question:
Do the suspensions handed out to role players, fourth-line grinders, and goons really matter?
Data suggests that, no, they don’t really matter. Here’s why:
First, let’s illustrate the point that having fourth- or even third-liner suspended doesn’t really affect a team in the standings. To obtain a somewhat accurate sample, I’ve compiled a list of every suspension in the past three years that has been five games or greater (numbers taken from capgeek.com). Then I filtered out the better players by disregarding any player who had an average time-on-ice number (TOI) greater than the “scrub median.” What’s the scrub median, you ask?
To clarify, a “scrub” is a general slang term/insult for a “bad” player in sports, at least in comparison to his/her competition. Since we want to filter out players that matter to a team and might positively affect their success in the standings, we really want to look only at the scrubs: fringe NHL players, sixth defensemen, fourth liners, and third liners to an extent. These are players that the fall below a certain TOI median: the scrub median.
To determine that mark, I took the average ice time, for each season since the 2005-06 lockout, of forwards in the #270 average TOI spot for forwards and the #150 spot for defensemen. Here’s how I determined those marks:
If you take the top three forward lines from all teams, that’s 270 players, so let’s make that the cutoff for forwards. It’s slightly arbitrary, since there are many factors that might skew that number (call-ups/send-downs, injuries, trades, etc.), but that number seems about right.
Since defensemen are more important, let’s just take the “sixth” defenseman and worse, meaning we can take the top-five TOI from each team, making the cutoff at 150. So, taking an average for each #270 forward and each #150 defenseman since the lockout, that gives us:
Forward scrub median*: 13:43 (range: 13:29 – 13:50)
Defensemen scrub median*: 18:00 (range: 17:47 – 18:22)
*These numbers are actually the averages, but I’m using the term “median” because it’s the cutoff line and sounds cooler.
So here’s all the data of players that have been suspended for 5+ games over the past 3 years and fell below the scrub median that year. For each suspension, I’ve listed:
- The incident date
- The length of the suspension
- The player’s average TOI that season (to show that they fall below the scrub median)
- The team’s record during that suspension, regular season only (records taken from nhl.com)
- The team’s record in the surrounding games, henceforth referred to as “outside” games. To show an accurate representation of the team’s performance with and without the player, it makes more sense to look at the team’s surrounding games rather than their entire season record to account for how well the team is playing at that time (i.e. hot and cold streaks). I included the same quantity of games as the suspension, so if a player was suspended for five games, I added the record of the team’s five games before the suspension and the five after (sometimes hitting either the end or beginning of the season, so not all data is consistent).
I’ve also listed the important part of the data, which is the difference in both points percentage (PP) and ROW (regulation and overtime wins) percentage (RP) without the player in that span.
I’m using only suspensions of five games or more because that’s really the only way to avoid randomness (one- or two-game spots don’t mean much) while providing enough data to illustrate the point. Additionally, those are the serious suspensions which corresponding plays need to be taken out of the game, since the short suspensions usually don’t cause an injury.
Also note that I’m not factoring whether or not the suspended players was dressed for those outside games (or even if they would have been dressed had they not been suspended), or considering other similar factors (injuries, schedule, etc.), because we’re only looking to see how lengthy suspensions affect team performance, and we should have enough data where those factors balance out.
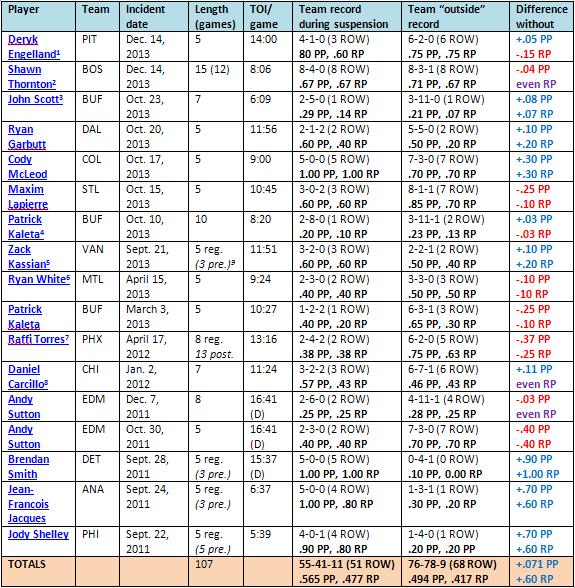
Here’s the data for players below the scrub median. Note that a “(D)” in the TOI spot means the player is a defenseman. Numbers were taken last night, Dec 2. Feel free to skip each individual player/team’s numbers, as it’s the TOTALS at the bottom that we’re mostly looking at. The last column is also important: it’s the team’s PP and RP during the suspension minus the team’s PP and RP outside the suspension. (Sorry that’s it’s aesthetically flawed, Wordpress is not the best tool for formatting tables, or formatting anything in general.)
| Player | Team | Incident date |
Length (games) | TOI/ game | Team record during suspension | Team “outside” record | Difference without |
| Deryk Engelland1 | PIT | Dec. 14, 2013 | 5 | 14:00 (D) | 4-1-0 (3 ROW)
80 PP, .60 RP |
6-2-0 (6 ROW)
.75 PP, .75 RP |
+.05 PP
-.15 RP |
| Shawn Thornton2 | BOS | Dec. 14, 2013 | 15 (12) | 8:06 | 8-4-0 (8 ROW)
.67 PP, .67 RP |
8-3-1 (8 ROW)
.71 PP, .67 RP |
-.04 PP
even RP |
| John Scott3 | BUF | Oct. 23, 2013 | 7 | 6:09 | 2-5-0 (1 ROW)
.29 PP, .14 RP |
3-11-0 (1 ROW)
.21 PP, .07 RP |
+.08 PP
+.07 RP |
| Ryan Garbutt | DAL | Oct. 20, 2013 | 5 | 11:56 | 2-1-2 (2 ROW)
.60 PP, .40 RP |
5-5-0 (2 ROW)
.50 PP, .20 RP |
+.10 PP
+.20 RP |
| Cody McLeod | COL | Oct. 17, 2013 | 5 | 9:00 | 5-0-0 (5 ROW)
1.00 PP, 1.00 RP |
7-3-0 (7 ROW)
.70 PP, .70 RP |
+.30 PP
+.30 RP |
| Maxim Lapierre | STL | Oct. 15, 2013 | 5 | 10:45 | 3-0-2 (3 ROW)
.60 PP, .60 RP |
8-1-1 (7 ROW)
.85 PP, .70 RP |
-.25 PP
-.10 RP |
| Patrick Kaleta4 | BUF | Oct. 10, 2013 | 10 | 8:20 | 2-8-0 (1 ROW)
.20 PP, .10 RP |
3-11-1 (2 ROW)
.23 PP, .13 RP |
+.03 PP
-.03 RP |
| Zack Kassian5 | VAN | Sept. 21, 2013 | 5 reg.(3 pre.)9 | 11:51 | 3-2-0 (3 ROW)
.60 PP, .60 RP |
2-2-1 (2 ROW)
.50 PP, .40 RP |
+.10 PP
+.20 RP |
| Ryan White6 | MTL | April 15, 2013 | 5 | 9:24 | 2-3-0 (2 ROW)
.40 PP, .40 RP |
3-3-0 (3 ROW)
.50 PP, .50 RP |
-.10 PP
-10 RP |
| Patrick Kaleta | BUF | March 3, 2013 | 5 | 10:27 | 1-2-2 (1 ROW)
.40 PP, .20 RP |
6-3-1 (3 ROW)
.65 PP, .30 RP |
-.25 PP
-.10 RP |
| Raffi Torres7 | PHX | April 17, 2012 | 8 reg.13 post. | 13:16 | 2-4-2 (2 ROW)
.38 PP, .38 RP |
6-2-0 (5 ROW)
.75 PP, .63 RP |
-.37 PP
-.25 RP |
| Daniel Carcillo8 | CHI | Jan. 2, 2012 | 7 | 11:24 | 3-2-2 (3 ROW)
.57 PP, .43 RP |
6-7-1 (6 ROW)
.46 PP, .43 RP |
+.11 PP
even RP |
| Andy Sutton | EDM | Dec. 7, 2011 | 8 | 16:41(D) | 2-6-0 (2 ROW)
.25 PP, .25 RP |
4-11-1 (4 ROW)
.28 PP, .25 RP |
-.03 PP
even RP |
| Andy Sutton | EDM | Oct. 30, 2011 | 5 | 16:41(D) | 2-3-0 (2 ROW)
.40 PP, .40 RP |
7-3-0 (7 ROW)
.70 PP, .70 RP |
-.40 PP
-.40 RP |
| Brendan Smith | DET | Sept. 28, 2011 | 5 reg.(3 pre.) | 15:37(D) | 5-0-0 (5 ROW)
1.00 PP, 1.00 RP |
0-4-1 (0 ROW)
.10 PP, 0.00 RP |
+.90 PP
+1.00 RP |
| Jean-Francois Jacques | ANA | Sept. 24, 2011 | 5 reg.(3 pre.) | 6:37 | 5-0-0 (4 ROW)
1.00 PP, .80 RP |
1-3-1 (1 ROW)
.30 PP, .20 RP |
+.70 PP
+.60 RP |
| Jody Shelley | PHI | Sept. 22, 2011 | 5 reg.(5 pre.) | 5:39 | 4-0-1 (4 ROW) .90 PP, .80 RP |
1-4-0 (1 ROW)
.20 PP, .20 PP |
+.70 PP
+.60 RP |
| TOTALS | 107 | 55-41-11 (51 ROW)
.565 PP, .477 RP |
76-78-9 (68 ROW)
.494 PP, .417 RP |
+.071 PP
+.060 RP |
Here’s the Word screenshot if the above is unreadable (click for large view)
1. Only 8 outside games instead of 10, as the Pens have played only three games since the suspension ended as of Jan. 2
2. Thornton has served only 12 games of his suspension, which is why only 12 games during suspension and 12 before the suspension were recorded.
3. Teammate Patrick Kaleta served his suspension in the first four games of Scott’s suspension as well.
4. The season started five games before the suspension (which is why there are only 15 outside games). Kaleta was waived after the suspension ended. Those games are included in the data since it was Buffalo’s decision.
5. Kassian’s suspension began in the preseason, meaning there were no “before” games to count.
6. Montreal’s 2012-13 regular season ended one game after the suspension ended.
7. The suspension carried over from the previous season. It was originally set for 25 games, but was later reduced to 21 (13 postseason, 8 regular season).
8. Carcillo received instant karma, as he was injured on the play in question, but that also means he did not play when his suspension was up: his team went 2-4-1 in the 7 games after the suspension ended. For the purposes of my argument, I will include all 14 outside games, since injuries can occur for anyone anyway.
9. “Pre.” represents preseason games, “post” represents postseason games, both of which don’t factor.
As you can see, overall, teams actually fared better without the suspended player in the lineup than with him. Eleven teams had a better points percentage without the player, while only seven had a worse PP.
Now as a sort of “control data,” let’s have a look at the players who meet the 5+ games criteria (past three years) but were above the scrub median:
| Player | Team | Incident date |
Length (games) | TOI/ game | Team record during suspension | Team “outside” record | Difference without |
| James Neal1 | PIT | Dec. 7, 2013 | 5 | 17:41 | 5-0-0 (4 ROW)
1.00 PP, .80 RP |
8-2-0 (8 ROW)
.80 PP, .80 RP |
+.20 PP
even RP |
| David Clarkson2 | TOR | Sept. 23, 2013 | 10 | 16:59 | 6-4-0 (5 ROW)
.60 PP, .50 RP |
5-5-0 (4 ROW)
.50 PP, .40 RP |
+.10 PP
+.10 RP |
| Duncan Keith3 | CHI | March 21, 2012 | 5 | 24:06 (D) | 2-1-2 (1 ROW)
.60 PP, .20 RP |
6-0-1 (5 ROW)
.85 PP, .71 RP |
-.25 PP
-.51 RP |
| Brad Marchand | BOS | Jan. 7, 2012 | 7 | 16:57 | 3-2-0 (2 ROW)
.60 PP, .40 RP |
6-3-1 (5 ROW)
.65 PP, .50 RP |
-.05 PP
-.10 RP |
| Rene Bourque | CGY | Jan. 12, 2012 | 5 | 17:49 | 3-2-0 (3 ROW)
.60 PP, .60 RP |
3-5-2 (1 ROW)
.40 PP, .10 RP |
+.20 PP
+.50 RP |
| James Wisniewski | CLB | Sept. 23, 2011 | 8 reg.(5 pre.) | 24:47 (D) | 0-7-1 (0 ROW)
.06 PP, 0.00 RP |
3-5-0 (3 ROW)
.38 PP, .38 RP |
-.32 PP
-.38 RP |
| TOTALS | 18-16-3 (15 ROW)
.527 PP, .405 RP |
31-20-4 (26 ROW)
.600 PP, .473 RP |
-.073 PP
-.068 RP |
Word version (click for large view):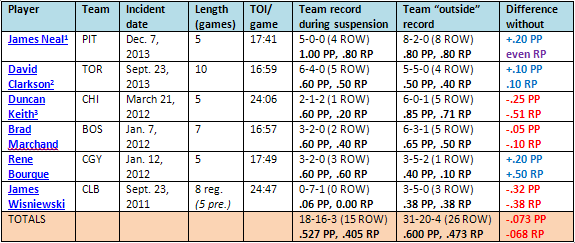
1. Engelland was also suspended the final two games of Neal’s suspension.
2. Clarkson’s suspension came during the preseason, so he missed the first 10 games of the Leafs’ regular season. Although this incident really has nothing to do with player safety, it’s worth using the suspension data for the purposes of the argument.
3. Chicago’s regular 2011-12 regular season ended two games after the suspension concluded.
Teams played worse without the players above the scrub median, which makes sense.
Now there are a few things to note about this data. The control is an extremely small sample size, so take those numbers with a grain of salt. It’s possible that taking the numbers from every suspension over the past three years might be more accurate for both tables, but smaller suspensions usually aren’t the result of dangerous plays and are usually given to habitually clean players. I’ll also admit that the overall combined records data might be a bit skewed because some teams factor into more games than others.
One might argue that the data means nothing because of the factors listed above and because a larger time span wasn’t covered. But even with the small sample size, the numbers suggest that suspensions to scrub players more often than not do not negatively affect the team. So do suspensions really matter if teams’ records are essentially, as a whole, unaffected?
Of course, suspensions aren’t entirely useless. At the least, they deter a player from taking cheap shots and making dangerous plays because they know they’ll get Shanabanned and, more importantly, lose payment. Keep in mind that most scrub players make minimal salaries (not to mention they lost money because of last year’s lockout). So at least individual players have a deterrent.
But is that enough? What about the teams that employ these players? What consequences do they suffer?
Well, using the data I just provided, they suffer no consequences, really. Other than being forced to donate money to the Player’s Emergency Assistance Fund instead of using said money on players, and having PR issues, the teams that choose to pay and dress cheap-shot artists are able to potentially eliminate division rivals’ players for extended periods of time, then simply replace the suspended player with another, all while sipping on expensive champagne in their goon-free suites.
In fact, the data suggests that teams are actually more likely to benefit from having a player suspended for a lengthy amount of time. And you shouldn’t be surprised, since replacing John Scott (who just scored his second career goal in 202 games) with literally anybody is an improvement to one’s roster. You’ll note that most players below the scrub median are replaceable. So why wouldn’t teams employ and dress guys who are probable to commit a dangerous, injury-inducing play on an opponent (debilitating that team), have him get suspended, replace him with a more skilled player (which could be the reason for the improved record numbers), and move on with their lives? As the “control” data suggests, teams are likely to have a worse record with a “good” player out.

(Bill Wippert/NHL/Getty Images)
As the system stands, it does not work. Teams, as a whole, need to feel the consequences of having one of their players suspended. What needs to change? Longer suspensions? The fear of being out too many games and losing salary would severely deter hitting. Have suspensions last for at least the same length the victimized player is out? Too harsh, and you want to punish the action, not the result; the same play can result in a severe or nonexistent injury based on sheer luck. Make teams pay out of pocket for damage caused as well as an extra fine? Not a bad idea, but most teams have the money for that anyway. So what, then?
Here’s my idea: In addition to the offending player being suspended, that player’s roster spot on the team is also suspended. I’ll explain:
If notorious goon Ogie Oglethorpe playing for the Atlanta Thrashers (since we’re using make-believe things here) uses his stick to chop off league star Adam Banks’s ear and is suspended for 30 games, then the Thrashers lose the ability to have a player dress in that roster spot for the same length; instead of being able to dress 20 players (18 skaters and 2 goalies), they can dress only 19 for the next 30 games (pending further suspensions).
Harsh? Ridiculous? Nonsensical? Maybe. But at least it, presumably, negatively affects the team employing the offender instead of just the player himself. That roster spot is much more important than most suspended players themselves. While losing the ability to dress one more player might cause more fatigue, and therefore worse play and increase injury risk, it’s worth making the amendment to the rules when you consider how much teams will try to avoid having that spot suspended and losing an option for the next XX games. It would probably benefit from testing in other leagues (i.e the AHL), and there’s no guarantee it would work, but common sense (or whatever you want to qualify my thoughts as) says it will.
Not only would this concept increase the efficiency of suspensions, but it would also potentially reduce suspendable plays from even happening in the first place. Would a team be willing to pay and dress a poorly skilled player if they know he’s likely to receive a suspension while not contributing much to the team? Probably not. Say goodbye to most infamous cheap-shot artists even playing in the NHL.
Additionally, taking a roster spot from a talentless goon and giving it to a skilled player will likely increase scoring and definitely increase overall skill, which is exactly what the game needs.
Some might say that this move would discourage teams from having players that can hit, meaning less physicality, and from having players that fight, meaning less protection amongst teams, which could actually lead to more suspendable plays. Hogwash. There are plenty of players who can fight, hit, defend teammates, provide energy, or all of the above without taking cheap shots. And some of them are really good players, too (see: Jarome Iginla).
Of course, the NHLPA would never allow its players to play shorthanded because of the injury/fatigue factor listed above. And there are still some talented players who take cheap shots (see: James Neal, Dustin Brown), and they’d still have a place in the league because their skill and ability to help their teams win overcompensate for the potential of a suspended roster spot. You can’t really change that. But at least it’s a start. At least the teams that employ dirty, dangerous players will feel, and hopefully understand, the similar consequences of their victims.
Sources: NHL.com; capgeek.com
Latest posts by Scott Finger (see all)
- Possible destinations for players on the block - February 25, 2014
- Why Suspensions Don’t Matter and how they can Be Fixed - January 3, 2014
- This Day in Hockey History – December 31 - December 31, 2013