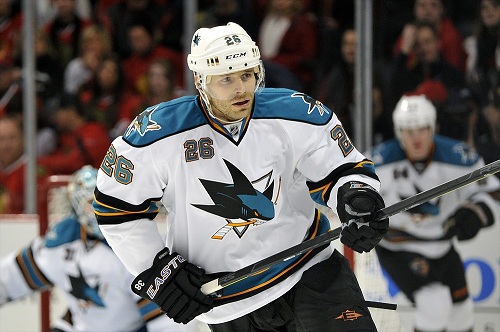
FeaturedHockey HousePrashanth's Piece of History

The Demise Of The 50 Goal Scorer And The 100 Point Scorer

As we are 2/3rds of the way through this NHL season, I thought it would be a good idea to examine one of the most peculiar trends that has been going on for the last few years. Where have all the 50 goal scorers and the 100 point scorers gone? As of 2/15/2012, we are on pace to have just 1 50 goal scorer (Steven Stamkos, on pace for 54) and 1 100 point scorer (Evgeni Malkin, 105 points). Flashback just 6 years ago to the first season after the lockout (2005-2006), and we had 5 50 goal scorers and 7 100 point scorers. Go back to 1992-1993, and we had 14 50 goal scorers and 21 100 point players! So what happened? What has caused such a drastic change. Sure coaches and general managers will tell you that today’s game takes place in a lower scoring era and that’s definitely true. However, what we don’t ever get to hear completely is why today’s game is slower. How has the game changed over the last 30 years? Well I’ll go back to 1979-1980, the rookie season of the NHL’s best player, Wayne Gretzky, and we’ll look and see how many 50 goal scorers and 100 point scorers we’ve had each season. After doing that, we’ll hypothesize as to how the game has changed to leave us with the game we see today.

In the list below, the seasons with fewer than 5 50 goal scorers are bolded. For range purposes, I will also show what the 20th highest scorer put up that season. I have projected out the 2011-2012 season and just used whoever was 20th in the NHL in scoring at the time for the 20th position.

1979-1980 –> 9 with 50 or more goals (Leader – Gare – 56). 20th best –> (McDonald – 40)

1980-1981 –> 8 with 50 or more goals (Leader – Bossy – 68). 20th best –> (Stastny – 39)

1981-1982 –> 10 with 50 or more goals (Leader – Gretzky – 92). 20th best –> (Napier – 40)

1982-1983 –> 7 with 50 or more goals (Leader – Gretzky – 71). 20th best —> (Ogrodnick – 41)

1983-1984 –> 8 with 50 or more goals (Leader – Gretzky – 87). 20th best –> (Coffey – 40)

1984-1985 –> 9 with 50 or more goals (Leader – Gretzky 73). 20th best –> (MacLean – 41)

1985-1986 –> 6 with 50 or more goals (Leader – Kurri – 68). 20th best –> (Foligno – 41)

1986-1987 –> 5 with 50 or more goals (Leader – Gretzky – 62). 20th best –> (Gallant – 38)

1987-1988 –> 8 with 50 or more goals (Leader – Lemieux – 70). 20th best –> (Olczyk – 42)

1988-1989 –> 6 with 50 or more goals (Leader – Lemieux – 85). 20th best –> (Ridley – 41)

1989-1990 –> 8 with 50 or more goals (Leader – Hull – 72). 20th best –> (Andreychuk – 40)

1990-1991 –> 4 with 50 or more goals (Leader – Hull – 86). 20th best –> (Gagner – 40)

1991-1992 –> 4 with 50 or more goals (Leader – Hull – 70). 20th best –> (Mogilny – 39)

1992-1993 –> 14 with 50 or more goals (Leader – Selanne/Mogilny – 76). 20th best –> (Oates – 45)

1993-1994 –> 9 with 50 or more goals (Leader – Bure – 60). 20th best –> (Kudelski – 40)

1994-1995 (LOCKOUT YEAR) –> 0 with 50 goals

1995-1996 –> 8 with 50 or more goals (Leader – Lemieux – 69). 20th best –> (C. Lemieux – 39)

1996-1997 –> 4 with 50 or more goals (Leader – Tkachuk – 52). 20th best –> (Recchi – 34)

1997-1998 –> 4 with 50 or more goals (Leader – Bondra/Selanne – 52). 20th best –> (Barnes – 30)

1998-1999 –> 0 with 50 or more goals (Leader – Selanne – 47). 20th best –> (Hull – 32)

1999-2000 –> 1 with 50 or more goals (Leader – Bure – 58). 20th best –> (Murray – 29)

2000-2001 –> 3 with 50 or more goals (Leader – Bure – 59). 20th best –> (Lemieux – 35)

2001-2002 –> 1 with 50 or more goals (Leader – Iginla – 52). 20th best –> (Yashin – 32)

2002-2003 –> 1 with 50 or more goals (Leader – Hejduk – 50). 20th best –> (Mogilny – 33)

2003-2004 –> 0 with 50 or more goals (Leader – Iginla – 41). 20th best –> (Lang – 30)

2004-2005 –> LOCKOUT NO SEASON

2005-2006 –> 5 with 50 or more goals (Leader – Cheechoo – 56). 20th best –> (Satan – 35)

2006-2007 –> 2 with 50 or more goals (Leader – Lecavalier – 52). 20th best –> (Smyth – 36)

2007-2008 –> 3 with 50 or more goals (Leader – Ovechkin – 65). 20th best –> (Parise – 32)

2008-2009 –> 1 with 50 or more goals (Leader – Ovechkin – 56). 20th best –> (Arnott – 33)

2009-2010 –> 3 with 50 or more goals (Leader – Crosby/Stamkos – 51). 20th best –> (Samuelsson – 30)

2010-2011 –> 1 with 50 or more goals (Leader – Perry – 50). 20th best –> (Crosby – 32)

2011-2012 (projected) –> 1 with 50 or more goals (Leader – Stamkos – 54). 20th best –> (Giroux – 33)

So what does this list tell us? The last few years have been almost on par with the pre-lockout numbers. The game was supposed to open up and yet goal scoring has barely budged. Looking at the ’80’s, you can see that if you scored 40 goals, you barely cracked the top 20 and in the case of 92-93, 40 goals put you outside of the top 25! Let’s take a look at how the 100 point seasons have corresponded. Seasons with fewer than 5 100 point scorers are bolded. Again the same projection criteria are used for this season

1979-1980 –> 8 with 100 or more points (Leader- Gretzky/Dionne – 137). 20th best –> (Shutt – 89)

1980-1981 –> 12 with 100 or more points (Leader – Gretzky – 164). 20th best –> (Dunlop – 87)

1981-1982 –> 13 with 100 or more points (Leader – Gretzky – 212). 20th best –> (Pederson – 92)

1982-1983 –> 11 with 100 or more points (Leader – Gretzky – 196). 20th best –> (Smyl – 88)

1983-1984 –> 12 with 100 or more points (Leader – Gretzky – 205). 20th best –> (Propp – 92)

1984-1985 –> 16 with 100 or more points (Leader – Gretzky – 208). 20th best –> (Goulet – 95)

1985-1986 –> 13 with 100 or more points (Leader – Gretzky – 215). 20th best –> (Ciccarelli – 89)

1986-1987 –> 7 with 100 or more points (Leader – Gretzky – 183). 20th best –> (Nicholls – 81)

1987-1988 –> 12 with 100 or more points (Leader – Lemieux – 168). 20th best –> (Larmer – 89)

1988-1989 –> 9 with 100 or more points (Leader – Lemieux – 199). 20th best –> (Sandstrom – 88)

1989-1990 –> 13 with 100 or more points (Leader – Gretzky – 142). 20th best (Neely – 92)

1990-1991 –> 11 players with 100 or more points (Leader – Gretzky -163). 20th best –> (Francis – 87)

1991-1992 –> 9 players with 100 or more points (Leader – Lemieux – 131). 20th best –> (Mullen – 87)

1992-1993 –> 21 players with 100 or more points (Leader – Lemieux – 160). 20th best –> (Francis – 100)

1993-1994 –> 8 players with 100 or more points (Leader – Gretzky – 130). 20th best (Bourque – 91)

1994-1995 (LOCKOUT YEAR) –> 0 with 100 or more

1995-1996 –> 12 with 100 or more points (Leader – Lemieux – 161). 20th best –> (Damphousse – 94)

1996-1997 –> 2 with 100 or more points (Leader – Lemieux – 122). 20th best –> (Hull – 82)

1997-1998 –> 1 with 100 or more points (Leader – Jagr – 102). 20th best –> (Lindros – 71)

1998-1999 –> 3 with 100 or more points (Leader – Jagr – 127). 20th best –> (Roenick – 72)

1999-2000 –> 0 with 100 or more points (Leader – Jagr – 96). 20th best –> (Lidstrom – 73)

2000-2001 –> 2 with 100 or more points (Leader – Jagr – 121). 20th best –> (Lang – 80)

2001-2002 –> 0 with 100 or more points (Leader – Iginla – 96). 20th best –> (Alfredsson – 71)

2002-2003 –> 3 with 100 or more points (Leader – Forsberg – 106). 20th best –> (Jagr – 77)

2003-2004 –> 0 with 100 or more points (Leader – St. Louis – 94). 20th best –> (Gomez – 70)

2004-2005 –> NO NHL SEASON

2005-2006 –> 7 with 100 or more points (Leader – Thornton – 125). 20th best –> (McDonald – 85)

2006-2007 –> 7 with 100 or more points (Leader – Crosby – 120). 20th best –> (D. Sedin – 84)

2007-2008 –> 2 with 100 or more points (Leader – Ovechkin – 112). 20th best –> (Savard – 78)

2008-2009 –> 3 with 100 or more points (Leader – Malkin – 113). 20th best –> (Ribeiro – 78)

2009-2010 –> 4 with 100 or more points (Leader – H. Sedin – 112). 20th best –> (Perry – 76)

2010-2011 –> 1 with 100 or more points (Leader – D. Sedin – 104). 20th best –> (Marleau – 73)

2011-2012 (projected) –> 1 with 100 or more points (Leader – Malkin – 105). 20th best –> (Whitney – 73)

So just by looking at this table, we can see a few things. Between 1979-1980 and the first lockout in 1994-1995, there was never a season that had less than 7 100 point scorers. We had a high of 21 100 point scorers in 1992-1993 and a low of 7 in 1986-1987. However, there have been 12 seasons of the past 31 that have had fewer than 5 100 point scorers and all of them have occurred in the 15 years.

What are some of the factors that have contributed to this?

1. Goaltenders of the early ’80s still predominantly used the standup style. The standup style involved playing upright and using the legs as a reactive device instead of a blocking device as they are used today. What I mean by that is when a shot came, a goaltender would take their leg and make a move to block the shot with their leg pad, by kicking at the puck or redirecting it to a corner. Nowadays, goaltenders will drop into a “position” and the puck will carom of their pads without them actually making an attacking move at the puck. The butterfly position that we see nowadays did not really become the predominant goaltending strategy until Patrick Roy arrived in the mid-80’s. Glenn Hall and Tony Esposito are widely credited with the creation of the butterfly style, but it never reached prominence until Patrick Roy. Another caveat that came with that goaltending style is the adoption of different equipment. Equipment was designed to aid the butterfly style. The butterfly calls for a goaltender to block and trap more shots instead of catching them with a glove, so more heavily armored pads were manufactured and thus the Koho, Reebok, and Vaughn pads were born.

2. Along those same lines, equipment, specifically goaltender leg pads, has vastly changed from 1979-1980 to today. Goaltenders’ pads have increased vastly in size over the years and one of the biggest changes has been the introduction of the “Box” pad in the late 90’s. As you can see, the introduction of the box pad seems to correspond with having just 8 100 point scorers between 1998-1999 and 2003-2004. These box pads are specifically designed for the butterfly style and allow a goaltender to keep the pad face perpendicular to the ice at all times. The NHL is currently working on reducing the size of the goaltenders pads (they are down to 11″ in width, and the height must be proportional to the player’s height), but that’s not enough, because fact of the matter is, goaltenders themselves are much bigger today.

3. In 1979-1980, the Vezina Trophy winners were Don Edwards who posted a 27-9-12 record and a 2.57 GAA and Bob Sauve who posted a 20-8-4 record and a 2.36 GAA. Edwards was  5’9″ 160 lbs and Sauve was 5’8″ 175 lbs. Below, you will see another chart of the Vezina winner, their height, and weight, and you will see how it has vastly changed. All heights and weights are taken from hockeyreference.com. Goaltenders with heights 5’10” or below are bolded. Keep in mind that the Vezina used to function as the Jennings trophy and it was given to the goaltender/goaltenders that played for the team that gave up the fewest goals. So if you see multiple winners for a season, that is why. Starting in 1981-1982, the Vezina was awarded to the most outstanding goaltender as it is today.

1979-1980 – Don Edwards 5’9″ 160 lbs; Bob Sauve 5’8″ 175 lbs

1980-1981 – Dennis Herron 5’11” 165 lbs; Michael Larocque 5’10” 200 lbs; Rich Sevigny 5’8″ 172 lbs

1981-1982 – Billy Smith 5’10” 185 lbs

1982-1983 – Pete Peeters 6’1″ 195 lbs

1983-1984 – Tom Barrasso 6’3″ 210 lbs

1984-1985 – Pelle Lindbergh 5’9″ 165 lbs

1985-1986 – John Vanbiesbrouck 5’8″ 176 lbs

1986-1987 – Ron Hextall 6’3″ 192 lbs

1987-1988 – Grant Fuhr 5’10” 201 lbs

1988-1989 – Patrick Roy 6’2″ 185 lbs

1989-1990 – Patrick Roy 6’2″ 185 lbs

1990-1991 – Ed Belfour 5’11” 202 lbs

1991-1992 – Patrick Roy 6’2″ 185 lbs

1992-1993 – Ed Belfour 5’11” 185 lbs

1993-1994 – Dominik Hasek 6’1″ 166 lbs

1994-1995 – Dominik Hasek 6’1″ 166 lbs

1995-1996 – Jim Carey 6’2″ 205 lbs

1996-1997 – Dominik Hasek 6’1″ 166 lbs

1997-1998 – Dominik Hasek 6’1″ 166 lbs

1998-1999 – Dominik Hasek 6’1″ 166 lbs

1999-2000 – Olaf Kolzig 6’3″ 224 lbs

2000-2001 – Dominik Hasek 6’1″ 166 lbs

2001-2002 – Jose Theodore 5’11” 185 lbs

2002-2003 – Martin Brodeur 6’2″ 215 lbs

2003-2004 – Martin Brodeur 6’2″ 215 lbs

2005-2006 – Miikka Kiprusoff 6’1″ 184 lbs

2006-2007 – Martin Brodeur 6’2″ 215 lbs

2007-2008 – Martin Brodeur 6’2″ 215 lbs

2008-2009 – Tim Thomas 5’11” 201 lbs

2009-2010 – Ryan Miller 6’2″ 175 lbs

2010-2011 – Tim Thomas 5’11” 201 lbs

Pay attention to the heights of the goaltenders that have their names bolded. Taking a look at this, we see that in the early part of the 80’s, the Vezina winners were much shorter and much lighter. From 1988-1989 on, no goaltender won the Vezina that was shorter than 5’11”. To even further hammer home that point, below is a list of the goaltenders taken in the 2011 NHL draft. Notice how only one of them is below 6 feet in height. That height differential really allows goaltenders to take away almost all angles when they drop to the butterfly, forcing forwards to really pick corners.

2011 NHL Draft – Goaltenders Selected

#38 – Magnus Hellberg – 6’5″ 185 lbs

#39 – John Gibson – 6’2″ 188 lbs

#49 – Christopher Gibson – 6′ 185 lbs

#62 – Samu Perhonen – 6’3″ 175 lbs

#71 – David Honzik – 6’3″ 195 lbs

#88 – Jordan Binnington – 6’1″ 156 lbs

#117 – Steffen Soberg – 5’11” 165 lbs

#132 – Niklas Lundstrom – 6’2″ 188 lbs

#157 – Jason Kasdorf –  6’3″ 180 lbs

#161 – Stephen Michalek –  6’2″ 183 lbs

#163 – Matt Mahalak – 6’2″ 183 lbs

#164 – Laurent Brossoit – 6’2″ 178 lbs

#178 – Adam Wilcox – 6′ 170 lbs

#181 – Lars Volden – 6’3″ 200 lbs

#182 – Frans Tuohimaa – 6’2″ 180 lbs

#188 – Anton Forsberg – 6’2″ 176 lbs

#190 – Garret Sparks – 6’2″ 200 lbs

#211 – Johan Mattsson – 6’3″ 200 lbs

4. Powerplays are down big time. Below is a list of the average power plays the NHL team had during a season and the average amount of power play goals scored. Also on the powerplays that teams are getting, they are not converting at the same rate as the teams in the ’80’s due to the increase in padding which allows for more players to block shots.

1979-1980 – 280 –> 61 PPG scored –> 21.9%

1980-1981 – 340 –> 77 PPG scored –> 22.5%

1981-1982 – 320 –> 73 PPG scored –> 22.9%

1982-1983 – 310 –> 71 PPG scored –> 22.9%

1983-1984 – 336 –> 74 PPG scored –> 21.9%

1984-1985 – 321 –> 71 PPG scored –> 22.2%

1985-1986 – 370 –> 82 PPG scored –> 22.1%

1986-1987 – 344 –> 72 PPG scored –> 21.0%

1987-1988 – 437 –> 89 PPG scored –> 20.3%

1988-1989 – 403 –> 85 PPG scored –> 21.0%

1989-1990 – 367 –> 76 PPG scored –> 20.8%

1990-1991 – 366 –> 71 PPG scored –> 19.4%

1991-1992 – 402 –> 77 PPG scored –> 19.2%

1992-1993 – 443 –> 87 PPG scored –> 19.6%

1993-1994 – 407 –> 76 PPG scored –> 18.6%

1994-1995 – 209 –> 37 PPG scored –> 17.7% (LOCKOUT SHORTENED SEASON – 48 GAMES)

1995-1996 – 413 –> 74 PPG scored –> 17.9%

1996-1997 – 336 –> 55 PPG scored –> 16.3%

1997-1998 – 380 –> 57 PPG scored –> 15.1%

1998-1999 – 359 –> 57 PPG scored –> 15.8%

1999-2000 – 331 –> 53 PPG scored –> 16.2%

2000-2001 – 376 –> 63 PPG scored –> 16.6%

2001-2002 – 338 –> 53 PPG scored –> 15.8%

2002-2003 – 363 –> 60 PPG scored –> 16.4%

2003-2004 – 348 –> 57 PPG scored –> 16.5%

2005-2006 – 480 –> 85 PPG scored –> 17.7%

2006-2007 – 398 –> 70 PPG scored –> 17.6%

2007-2008 – 351 –> 62 PPG scored –> 17.8%

2008-2009 – 341 –> 65 PPG scored –> 19.0%

2009-2010 – 304 –> 56 PPG scored –> 18.2%

2010-2011 – 291 –> 52 PPG scored –> 18.0%

2011-2012 – 307 –> 54 PPG scored –> 17.4% (projected)

So if you think about it, we complain a lot nowadays about how there are so many penalties called and to just “let the players play like the good ol’ days”. However, the “good ol’ days” were filled with penalties and an incredible amount of power play goals. Looking at the 1987-1988 season, there were 89 power play goals scored on average per team. That means the average team was scoring a power play goal a night! Nowadays, the average team scores a powerplay goal every other game. That makes a huge difference in the scoring numbers and provides a real solid explanation as to why goal scoring is down in this era. Looking at the 05-06 season, immediately after the lockout, we see that the league was calling penalties at a record clip, the highest amount of penalties called in the past 31 years. However, as I mentioned before, teams did not convert those powerplays as well due to the increased pad size of players, the increase in shot blocking, and the increase in overall size of the players. It is much harder to get your shot through in today’s game. However, we can also see that the league has rapidly gone away from that whistle-filled game, dropping almost 100 penalties the following year and hitting a 30 year low in 2010-2011 by calling just an average of 291 penalties on each team. 2011-2012 is projected to be right around those numbers so maybe we’ve hit a period of consistency.

5. The invention of defensive systems. Jacques Lemaire is widely credited with the instillation of the neutral zone trap into the game of hockey. During his first tenure with the Devils (1993-1998), Lemaire instituted a trap where all 5 players on the ice would clog the neutral zone, making it near impossible to stickhandle the puck into the offensive zone. Because the two-line pass rule was still in effect, opposing teams were forced to stickhandle the puck into the neutral zone before making a pass through the trap to start on offense. This trap, which was soon implemented by other teams, also used a lot of “clutching and grabbing”, and a significant amount of minor hooks to slow the opposition through the neutral zone. It actually got so bad, that it prompted Mario Lemieux’s first retirement. Other defensive systems were also instituted such as the “left wing lock” which was used heavily by the Detroit Red Wings under Scotty Bowman. The lock involved having the left winger drop back and essentially function as a third defenseman, making it nearly impossible for the opposing team to generate odd man rushes. This system was also employed around the same time as Lemaire’s neutral zone trap and it resulted in some significant changes. At the time of their implementation (roughly 1993), the league was coming off a high of 21 100 point scorers and 14 50 goal scorers. Just 4 years later, those numbers were down to 4 50 goal scorers and 1 100 point scorer. These traps existed all the way until the 2nd NHL lockout in 2004-2005. The 2nd NHL lockout helped stop these traps by allowing 2 line passes as well as forcing referees to call any and all obstruction penalties. This made it very difficult for the defense to stop opposing forwards coming with speed through the neutral zone and theoretically “opened” the game back up.

So what have we learned from this? Scoring in the NHL is down for sure, and there are a variety of causes for it. First and foremost, the size of goaltenders has increased dramatically as well as the size of their equipment. With the introduction of the butterfly style, it has become incredibly difficult for forwards to score. We also see that powerplays in general have been down and are around 30 years lows at the moment. Teams are converting at a worse percentage as well due to the increase in player size, the better padding and equipment provided, and the increase in the willingness to block shots. Finally, the invention of defensive systems to make up for being less talented offensively really slowed down the NHL in the mid-90’s and through the early 2000’s. The lockout in 2004-2005 was meant to improve the game of hockey as all of the obstruction through the neutral zone had made the game unappealing. However, after a strong first two years, the league is back to being lower scoring, but at least there is not as much obstruction in the neutral zone. For the league to really become more high scoring, it will have to consider increasing the size of the nets, increasing the space behind the net, or perhaps come up with a solution to improve powerplay percentage such as forcing teams to kill the entire 2 minutes, or calling icing on the shorthanded team. We’ll see what the NHL chooses to do, but the fact of the matter is that scoring is down in a big way and if the NHL wants to continue to compete with the NBA, it will have to introduce a little more scoring into the game without altering the game in a big way.


Prashanth Iyer

Prashanth Iyer

Prashanth is a third year doctor of pharmacy student at the University of North Carolina Eshelman School of Pharmacy in Chapel Hill, NC. Prashanth is studying to be an infectious disease pharmacist, but in his spare time, he watches any hockey game he can catch. He was born and raised just outside Detroit, Michigan and hence is a big Red Wings fan. He is always willing to hear any and all debates pertaining to his articles, so feel free to contact him.
Back to top button