
Apparently, Anders Lindback wasn’t tall enough.
The Tampa Bay Lightning have traded Cory Conacher, a Rookie of the Year candidate and the reigning American Hockey League Most Valuable Player, alongside a fourth-round draft pick in 2013 in exchange for 6-foot-7 Ottawa Senators goaltender Ben Bishop.
Lindback, by the way, stands at 6-foot-6.
Now take a deep breath, Lightning fans, because this one probably stings a bit. Conacher became vastly popular in Tampa Bay during his hot start to 2013, and he is currently second among rookies with 24 points. He is a very likeable, scrappy player who many compared to forward Martin St. Louis when he broke out early in the season.
However, he has come back down to Earth a bit with just 6 points in his last 16 games. Perhaps management saw a worsening in play that most people overlooked.
We could easily look back in a couple years and see that the Lightning sold high on Conacher, and they got a great deal for him. Although I like Conacher, that’s not the part of the trade that will determine whether general manager Steve Yzerman made the right move.
The most important aspect of the trade will be the determination of Bishop’s skill as a goaltender. Tampa Bay went the route of picking up a young back-up goalie in the offseason with Lindback, and that hasn’t exactly been an effective strategy.
Granted, Lindback is still young, but bringing in competition for him seems counterproductive to his success. The Lightning are clearly shifting their saddle to the back of Ben Bishop.
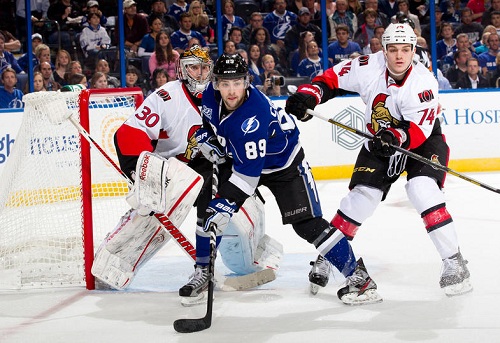
(Scott Audette/NHLI via Getty Images)
Bishop, 26, has a 2.58 goals-against average and a .922 save percentage in 13 games for the Senators this season. His eight victories are also tied for the Senators team lead.
“I am extremely excited to be part of the Lightning organization,” Bishop said. “They have a lot of great players, and hopefully we can win a lot of hockey games this season and moving forward.”
While Bishop will certainly be an upgrade over the hapless Mathieu Garon, Yzerman putting his credibility behind yet another unproven back-up seems conspicuous. After hiring another unproven coach out of the minor leagues last week with Jon Cooper, Yzerman has put all of his chips on the table.
If this succession of moves doesn’t pay off, Yzerman will be out of a job. If Bishop can help to buck the trend, Yzerman will be praised.
For now, Tampa Bay, have patience. Let the storm blow over, give Bishop a chance and see where this team goes. A goaltender was exactly what this team needed, and they got one.
We just have to wait and see whether Ben Bishop is the right one.
Latest posts by Taylor Gaines (see all)
- Shades of Grey: Hope and Fear Intertwined for the 2015-16 Lightning - October 7, 2015
- Top 5 Tampa Bay Lightning Players of All-Time - August 18, 2015
- Stanley Cup Final: ‘Experience’ Is Irrelevant - June 9, 2015