
Moneypuck: Examining the Blue Jackets Individual On-Ice Advanced Statistics

After my Introduction to Advanced Statistics article went up last week, the Washington Post published an article by Neil Greenberg which provides evidence that advanced statistics are gaining traction around the NHL, even in the front offices. I’m not taking credit for being the catalyst to his piece or anything of the sort, but it’s important to bring everyone on board with these statistics as they are becoming increasingly popular. They’re also great if you wish to win arguments with your friends, and who doesn’t?
Once we have grasped what advanced statistics can show us about a team overall, we can continue to look further and examine what they can show us about an individual player.
Note: As a reminder, Corsi is the sum of all shots attempts (missed, blocked and on goal).
These stats were pulled from stats.hockeyanalysis.com on December 29th. According to the FAQ at Hockey Analysis, their statistics are updated every Monday, Wednesday and Friday, so these statistics are likely to be missing the results of the Blue Jackets last two games.
At this point of the season, the Blue Jackets are 24th overall in Corsi%. The team is driving only 47.8% of the possession play. They have played much better recently, registering a positive Corsi% (above 50%) in 9 out of their past 12 games and their numbers are improving overall on the season. This also correlates with their recent record, going 7-4-1 in their last 12 games. Similarly, their Corsi% began to increase during the last half of last season when they got hot and just barely missed the playoffs.
Now, let’s take a look at the players, individually, who have a minimum of 100 minutes played in 5-0n-5 Corsi Close situations. (Corsi Close generally refers to situations when the game is tied or within 1 goal. It removes the bias that occurs when a team sits on a larger lead.)
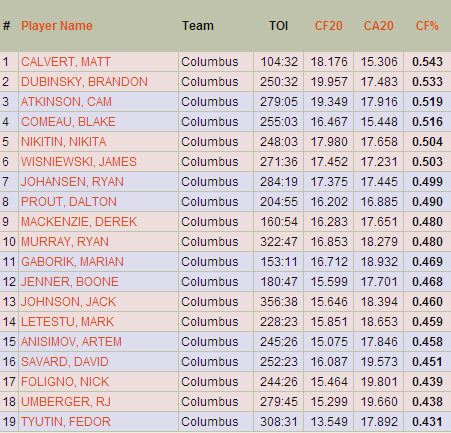
What we are looking at with this graph is Blue Jackets players’ performance separated by their Corsi for%, which is Corsi for divided by (Corsi for + Corsi against). CF20 is the shot attempts the team takes while that player is on the ice per 20 minutes, and CA20 is shot attempts against per 20 minutes.
At first glance it appears that most of the Blue Jackets have a less-than-favorable CF%, with only 6 out of 19 players above 50%. It’s also apparent how important Matt Calvert is to the team when he is in the lineup. At 54.3% he’s not the best in the league, but his presence on the ice attributes to a high rate of shot attempts. Calvert has only played 17 games this season due to several injuries and his absence likely has a negative impact on the team.
Perhaps the biggest surprise is the performance of Jack Johnson. He’s a fan favorite and will probably find himself on the Team USA’s Olympic roster again. However, Johnson has never had good possession numbers. We’ll look at Johnson’s numbers more in depth later in the Moneypuck series but I don’t want you to be surprised at how unfavorable his statistics have been throughout his career. Make no mistake about it, Johnson is incredibly athletic and has an offensive upside but his main responsibility, keeping the puck of the defensive zone, is something he isn’t excelling at.
Now that we are beginning to get familiar with individual statistics, let’s take this one step further.
Tyler Dellow, writer at Sportsnet and one of the most influential bloggers in the advanced stats community, recently published a piece on his blog titled “Visualizing Corsi and the Jets”. His post focused on identifying which players were driving possession play for the Winnipeg Jets. He accomplished this goal with a chart that listed forwards based on their time on ice and their Corsi% when paired with a defenseman, who were also separated per TOI.
The idea behind his exercise was that we should see the players who get more TOI during 5-on-5 situations have a higher Corsi% when paired together. Well, let’s take a look at the Blue Jackets.
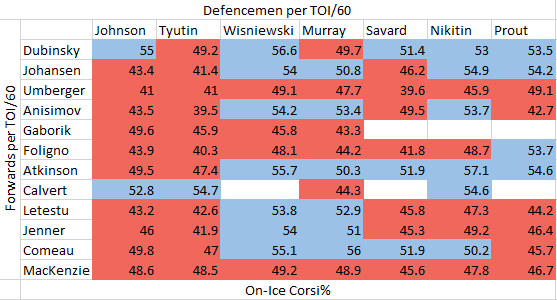
The consistency with Dellow’s theory are not contained within this chart, even though it was consistent with the Jets, but there are a few things we can take away from this.
First, the top defensive pairing is Fedor Tyutin and Jack Johnson, but when they are on the ice they are almost always below 50% with any forward they are paired with. However, Tyutin’s numbers are consistently lower than Johnson’s, which could be pulling Johnson’s numbers down. Anyway you look at it, it’s terribly difficult to justify Johnson and Tyutin as a top defensive pairing. Meanwhile, James Wisniewski and Ryan Murray have pretty good numbers and should be given more minutes if you want to go by these stats. Coach Todd Richards has awarded the two of them the starting position in a few games but based on this data, they would certainly be my go-to players.
Matt Calvert and Brandon Dubinsky’s statistics hold up from the chart we examined earlier. They’re certainly performing well with any of the defensemen they play with.
The biggest surprises in this chart to me are Derek MacKenzie and Blake Comeau. As a 4th-liner, MacKenzie’s numbers look pretty good. He never exceeds 50% but he’s played close to it with all the defenders. Comeau has moved up and down in the lineup this season but he’s been fairly consistent and deserves credit as well. Neither of these players put up a large amount of points but keeping possession in the offensive zone keeps the puck out of their zone and reduces the risk of being scored on. You really can’t ask for much more from your bottom-6 players.
One more thing we can see is that Nick Foligno and RJ Umberger have played a significant amount of time on the top 2 lines. Their numbers are less than favorable but they have contributed to some of the scoring this season. Once Nathan Horton returns it would make sense to put Foligno or Umberger in the bottom 6 where they can add some depth scoring without giving up as many shot attempts against due to their reduced minutes. Nathan Horton has graded exceptionally well statistically throughout his career and it’ll be exciting to see what he can add to this team when he finally makes his debut, which should be very soon.
You can make several analyses out of this chart and we’ve only used the smallest amount of data that is available to us. The world of advanced statistics is incredibly interesting and I encourage you to continue looking into it on your own. I’ll continue to provide more analyses over the next few weeks.
Nick Biss
Latest posts by Nick Biss (see all)
- Rick Nash Becomes the Villain in Columbus - March 23, 2014
- Blue Jackets Lose An Exciting Game to the Sharks, Which was Ruined by a Shootout - March 14, 2014
- Blue Jackets Forward Blake Comeau Suspended Two Games For Boarding Red Wings Brendan Smith - March 12, 2014

[…] I’ve been running a “Moneypuck Series” over at Hooked on Hockey Magazine. I’ll have the next one up in the next day or two, focusing on Horton. For now, here’s […]